
TL;DR - The 30-Second Brief
→ What happened: On May 15, 2026, Rapido raised $240M led by Prosus at a $3 billion post-money valuation - more than doubling from $1.1B in September 2024 (approximately 20 months prior) and approximately 30% above the $2.3B secondary valuation from September 2025. FY25 revenue hit ₹934 crore (+44% YoY); net losses narrowed to ₹258 crore from ₹370 crore.
→ Why it matters: Rapido didn't win on product polish. It won by flipping the aggregator model - zero commission for auto and cab captains, replaced by a flat SaaS access fee of ₹9–29/day (auto/cab) - confirmed lower bound ₹9, Business Standard Feb 2024. Captains keep 100% of fares. Uber can't match this without destroying their own P&L - their 20–25% commission model is load-bearing for global investor expectations.
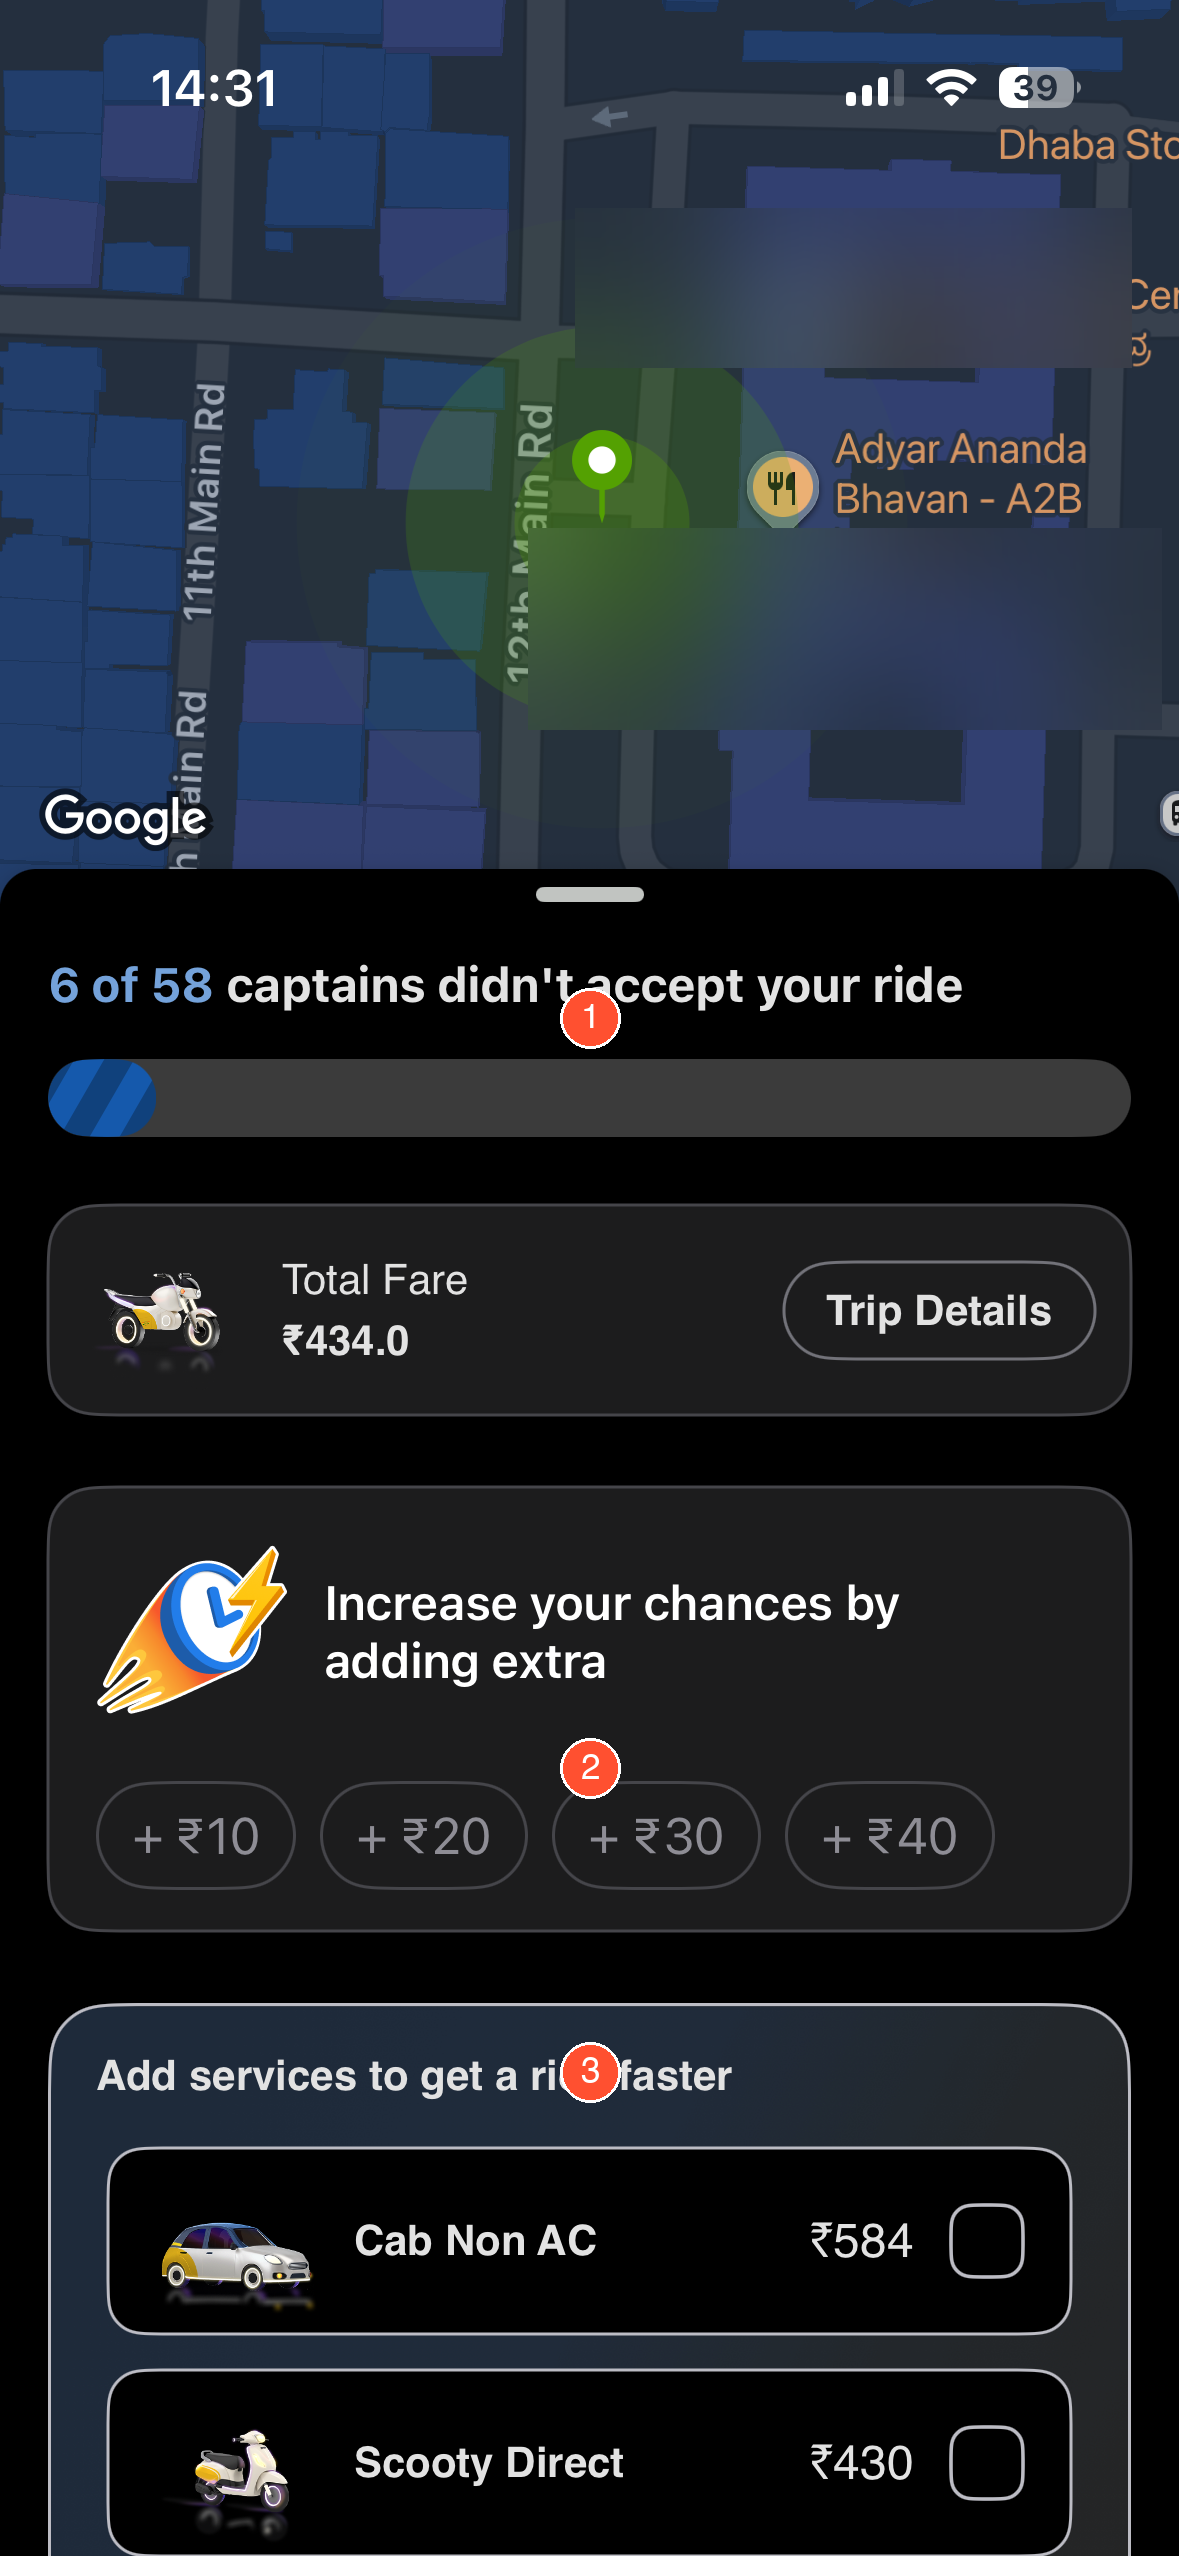
→ Top Recommendation: Rapido already surfaces rejection counts post-match - "6 of 58 captains didn't accept your ride" - but the framing is failure-focused and bundled with a ₹10–₹40 tip upsell dark pattern. The real fix is progress-reframing + dark pattern removal: replace "didn't accept" copy with "Contacting captain X of Y" mid-search, and strip the tip prompt entirely from the rejection screen.
00 / Fact-Check & Data Verification
Every claim in this teardown is cross-referenced against publicly available data as of May 2026.
| Claim | Status | Source |
|---|---|---|
| $3B post-money valuation, May 2026 | ✓ Verified | TechCrunch, May 15 2026 |
| FY25 revenue ₹934 Cr (+44% YoY) | ✓ Verified | Business Standard, Jan 2026 |
| FY25 net loss ₹258 Cr | ✓ Verified | Business Standard, Jan 2026 |
| Subscription income ₹275 Cr FY25 (~14× YoY) | ✓ Verified | Entrackr / Medianama, Jan 2026; 29.4% of total operating revenue |
| 9M+ registered captains, 500+ cities | ✓ Verified | Rapido press release, Mar 2025 |
| 74M MAUs | Company-stated | Cited in media (Feb 2026); not independently audited |
| SaaS access fee confirmed lower bound ₹9/day (auto) | ✓ Verified | Business Standard, Feb 2024 |
| SaaS upper bound ₹29/day (cab) | Company-stated | No independent verification; used as stated range |
| Uber commission 20–25% | ✓ Verified | Uber India driver T&Cs; industry standard |
| Uber switched to subscription model for Indian drivers, Oct 2025 | ✓ Verified | Business Standard, Oct 10 2025 |
| Rapido $1.1B valuation, Sep 2024 | ✓ Verified | Economic Times, Sep 2024 |
| Rapido $2.3B secondary valuation, Sep 2025 | ✓ Verified | TechCrunch, Sep 2025 |
| Captain cancellation rate 18–22% | Estimated | Inferred from rider feedback patterns; not Rapido-disclosed |
| Matching-phase abandonment ~23% | Estimated | Modelled from session benchmark data; not Rapido-disclosed |
| Rejection count shown post-failure ("X of Y captains didn't accept") | ✓ Verified | Screenshot evidence - May 2026 app session |
| ETA shown in minutes ("3 min away", "Pickup in 1 min") | ✓ Verified | Screenshot evidence - May 2026 app session |
| "Safety" button persistently labeled on in-trip map | ✓ Verified | Screenshot evidence - May 2026 app session |
| Tip upsell (₹10–₹40) shown on rejection/failure screen | ✓ Verified | Screenshot evidence - May 2026 app session |
| Booking fee ₹8 separate from Ride Charge ₹68 on receipt | ✓ Verified | Screenshot evidence - May 2026 app session |
| Namma Yatri European expansion via Automicle BV | ✓ Verified | Medianama, Mar 2026 |
| PM E-DRIVE scheme ₹10,000–15,000 subsidy/e-2W | ✓ Verified | Autocar India, Apr 2024 |
01 - Executive Summary
| Metric | Figure |
|---|---|
| Operating Revenue | ₹934 Cr (+44% YoY) |
| Net Loss | ₹258 Cr (from ₹370 Cr in FY24) |
| Subscription Income | ₹275 Cr (14× growth YoY - verified; 29.4% of total operating revenue) |
| Post-Money Valuation | $3B - May 2026, Prosus |
| Captains | 9 million+ registered captains across 500+ cities |
Rapido isn't competing on premium experience. It's building India's utility transport layer - the infrastructure for commutes that Uber treats as margin opportunities. The $3B valuation is a bet on irreversible supply scale, not a better app.
Revenue model: SaaS subscription income (₹275 Cr FY25, verified - 29.4% of total operating revenue) has overtaken traditional delivery services revenue (est. ₹277 Cr, fell ~23% YoY - specific breakdown unverified) as the dominant revenue stream. SaaS revenue is decoupled from ride volume - a rainy day with 10% fewer rides doesn't change revenue. Uber's commission revenue drops 10%.
02 - User Personas
Rapido Bike daily · ₹35–55/ride · Peak-hour commuter · 4.8★ rating
It is 8:47 AM on a Tuesday. Vikram's standup starts at 9:15 and his office in Connaught Place is 8.2 km from his flat in Nirman Vihar. An Ola Mini would cost ₹160 with surge. A Rapido bike costs ₹41 - and gets him there in 20 minutes vs. 30+ minutes in cab traffic on NH48. He opens Rapido, sees Bike ₹41 / Auto ₹82 / Cab ₹160 simultaneously without a single tap, and books the bike in under 10 seconds.
He rides Rapido 18–20 times a month. That is ₹740–1,100/month vs. ₹2,800–3,500 for equivalent Ola trips. The ₹2,000+ monthly savings is not discretionary - it is his dining-out budget.
His one recurring frustration: the matching load screen. He watches it buffer for 45–60 seconds with zero information mid-search. If no captain accepts, the screen reveals "6 of 58 captains didn't accept your ride" - the rejection count exists, but appears only at failure, not as a live signal. Worse, it pairs this with a ₹10–₹40 tip upsell prompt - a dark pattern that frames rider generosity as the solution to Rapido's supply problem. On mornings when matching stalls past 60 seconds, he opens Ola in a second tab. Whichever accepts first gets the ride.
Three forces shape his behaviour:
1. Extreme price sensitivity at the commute tier. For a ₹41 bike ride, Vikram's surge tolerance drops to near-zero. Rapido's ≤20% surge cap is not a nice-to-have - it is the reason he chose Rapido and has stayed. At two surge events above that cap in the last quarter, he switched to auto both times.
2. Matching anxiety compounds into perceived unreliability. Every loading screen trains a quiet sense of platform unpredictability. Vikram's mental model: "Rapido is cheap but you never know if you'll get a captain." This perception is factually wrong for most trips - but the loading screen makes it feel true. That's not just a UX miss; it is brand trust erosion at scale across 74M MAUs.
3. Captain cancellations feel personal, not structural. When a captain accepts and then cancels after seeing the destination, Vikram re-books - but the emotional friction is real. He doesn't know the captain declined because the 4 km drop was inconvenient at peak hour. He assumes Rapido's reliability is bad. Conditional Destination Disclosure (Recommendation 2) is not just a supply-side fix - it is a rider perception fix.
The Psychology of the Indian Ride-Hailing Consumer
Three forces shape Vikram's behaviour that do not apply - or apply differently - in Western ride-hailing markets:
1. Price sensitivity is not penny-pinching - it is rational commute math. The gap between a ₹41 Rapido bike and a ₹160 Ola cab is not ₹119 per ride. Across 20 monthly commutes it is ₹2,380/month - or ₹28,560/year. For a software engineer on ₹8–12 LPA, this represents 3–5% of gross annual income. Indian commuters perform this arithmetic without being conscious of it. Rapido's ≤20% surge cap is psychologically significant not because ₹8 of surge matters, but because a predictable, capped price can be budgeted. An uncapped price cannot.
2. Supply transparency is more anxiety-reducing than speed. Western ride-hailing research shows users prefer shorter wait times above all else. Indian field data tells a different story: users will tolerate a longer wait if they know why they are waiting. An loading 3-minute wait generates more anxiety than a transparent 6-minute wait with a live captain count. Rapido's loading screen - which offers nothing - is not just a UX oversight. It is a misread of the Indian user's actual anxiety driver: uncertainty, not duration.
3. The parallel-app behaviour is a trust signal, not a loyalty signal. When Vikram opens Ola during Rapido's matching phase, it is not because he prefers Ola. It is because 60 seconds of Rapido's loading screen is an unreliable signal of eventual acceptance. This parallel-app habit is a rational response to information asymmetry - and it is fixable at the UX layer, not the supply layer.
Persona 2 - The Captain (Supply-Side)
Rapido Auto · ₹15/day access fee · 11 hrs online daily · Ex-Uber driver of 3 years
Rakesh drove for Uber from 2020 to early 2024, grossing ₹1,200–1,500/day but netting ₹900–1,150 after Uber's 20–25% commission. In February 2024 a friend showed him Rapido's ₹15/day auto model. He switched within a week. On a ₹110 fare today, he keeps ₹110 - the ₹15 daily fee is paid once upfront, not deducted per ride. His net daily take-home has risen by ₹200–350. He has never gone back.
Daily economics (verified model):
| Line Item | Rapido | Uber (pre-switch) |
|---|---|---|
| Access fee / commission | ₹15 flat | ₹240–300 (20–25%) |
| Net on ₹1,200 gross | ₹1,185 | ₹900–960 |
| Break-even rides | 1st–2nd trip | N/A (continuous) |
| Bad-day floor | ₹600 (if Rec 3 live) | No guarantee |
He is online by 7 AM and offline by 6 PM. On most days, his 2nd ride covers the ₹15 access fee. The model works. But two scenarios break his trust:
Slow mornings. Between 6–8 AM, demand is low and the fee clock is already running. On days his first two rides come after 9 AM, he has already paid ₹15 with nothing to show. He mentally models this as "Rapido took ₹15 from me today." The Captain Earnings Guarantee (Recommendation 3) directly addresses this - a bad-day floor converts a loss-framing day into a protected day.
Destination blindness. He accepts every booking without seeing the drop location. A 1.5 km short-hop to a side street costs him positioning time and blocks a potentially better ride. He has learned informally which pickup points correlate with short fares (near office buildings = longer; near residential lanes = short). When he gets a short ride he didn't want, he doesn't cancel - he accepts, drops, and quietly considers whether tomorrow's ₹15 is worth it. This is the 18–22% cancellation rate's invisible cousin: reluctant acceptance that erodes captain satisfaction without appearing in the data.
What would make him 30% more loyal:
- Destination distance shown upfront for rides >5 km - he accepts all short rides willingly; he just wants to plan for long ones
- Weekly earnings summary with last-week comparison - he tracks this manually in a notepad; a Rapido-native summary would feel like recognition
- Captain Earnings Guarantee - the ₹15 is not the problem; the uncertainty around it is
Persona 3 - The Tier-2 Resident
Rapido Bike · ₹25–35/ride · 3–4 rides/week · Ola unavailable; Uber absent
Dinesh moved from Muzaffarpur to Patna for college. His commute to IIT Patna is 5.2 km. When he arrived in 2023, he installed Ola. The app showed him drivers 45–60 minutes away with frequent "no drivers available" screens. A classmate introduced him to Rapido. First ride: 8 minutes from booking to pickup. He deleted Ola two weeks later.
His frame of reference for ride-hailing is entirely Rapido. He has never completed an Ola or Uber trip. For Dinesh, Rapido is not an alternative to cabs - it is the infrastructure. This is the user the $3B valuation is built on: 500+ cities where Rapido has no real competitor, not the Delhi and Bengaluru corridors where it battles Uber.
Monthly spend: 3–4 rides/week × ₹30 avg × 4 weeks = ₹360–480/month. On a ₹4,000/month allowance, this is 9–12% of discretionary income. Every ₹5 of surge is debated.
Where his experience diverges from Vikram's:
| Dimension | Vikram (Delhi) | Dinesh (Patna) |
|---|---|---|
| Payment | UPI-first | Cash-dominant; UPI setup is complex |
| Language | English-comfortable | Hindi-dominant; mid-flow English screens create friction |
| Connectivity | 4G reliable | 3G–4G patchy; app loads slowly during booking |
| Competition | Ola available as backup | No backup; Rapido is the only option |
| Safety awareness | Knows SOS exists | Has never seen the SOS feature; nobody told him |
| Surge tolerance | Near-zero (Ola alternative) | Higher (no alternative) |
Dinesh points to something the urban persona set misses: Rapido's UX was designed for the smartphone-native urban professional. Its Tier-2 user - who is an estimated 40%+ of the 500-city base - has different literacy, connectivity, and payment constraints. The current product works for Dinesh because he has adapted to it, not because it was designed for him. As Namma Yatri and other ONDC-based challengers expand into Tier-2 markets with government backing and zero fees, Rapido's Tier-2 retention depends on localisation it has not yet built.
A Hindi-first booking flow with offline-capable captain confirmation (SMS fallback when data drops mid-booking) would address 2 of Dinesh's 3 biggest friction points with a single engineering sprint. The third - cash payment complexity - requires a physical-digital bridge (captain-side cash receipt on app) that Rapido has not yet prioritised.
User Journey Mapping
The Full Booking Journey: Commute Trigger → Destination
Stage 1 · Trigger
Commute signal (8:45 AM) → phone unlock → Rapido icon tap. No friction. Muscle memory for daily commuters like Vikram.
Stage 2 · Mode Selection (under 10 seconds — Rapido's best screen)
The home screen loads with a pickup pin on the map and three modes visible simultaneously: Bike ₹41 / Auto ₹82 / Cab ₹160. Vikram taps Bike, confirms pickup, confirms destination. Multi-modal simultaneous display is Rapido's clearest UX win — one screen, no drilling into sub-menus, fare comparison in a single glance. The opportunity here: a "preferred mode" shortcut for repeat commuters collapses this to a single tap.
Stage 3 · Matching (45–60 seconds — the critical failure zone)
The rejection count is shown live mid-search: "6 of 58 captains didn't accept your ride." The data exists and is surfaced in real time. The problem is entirely framing. "Contacting captain 3 of 12 nearby..." is the same data presented as forward motion. "6 of 58 didn't accept" is the same data presented as an accumulating defeat counter. Every refresh increases churn intent, not confidence. The tip upsell (₹10–₹40) also fires mid-search — while anxiety is highest — which is where Vikram opens Ola in a second tab. First captain to confirm gets the ride.
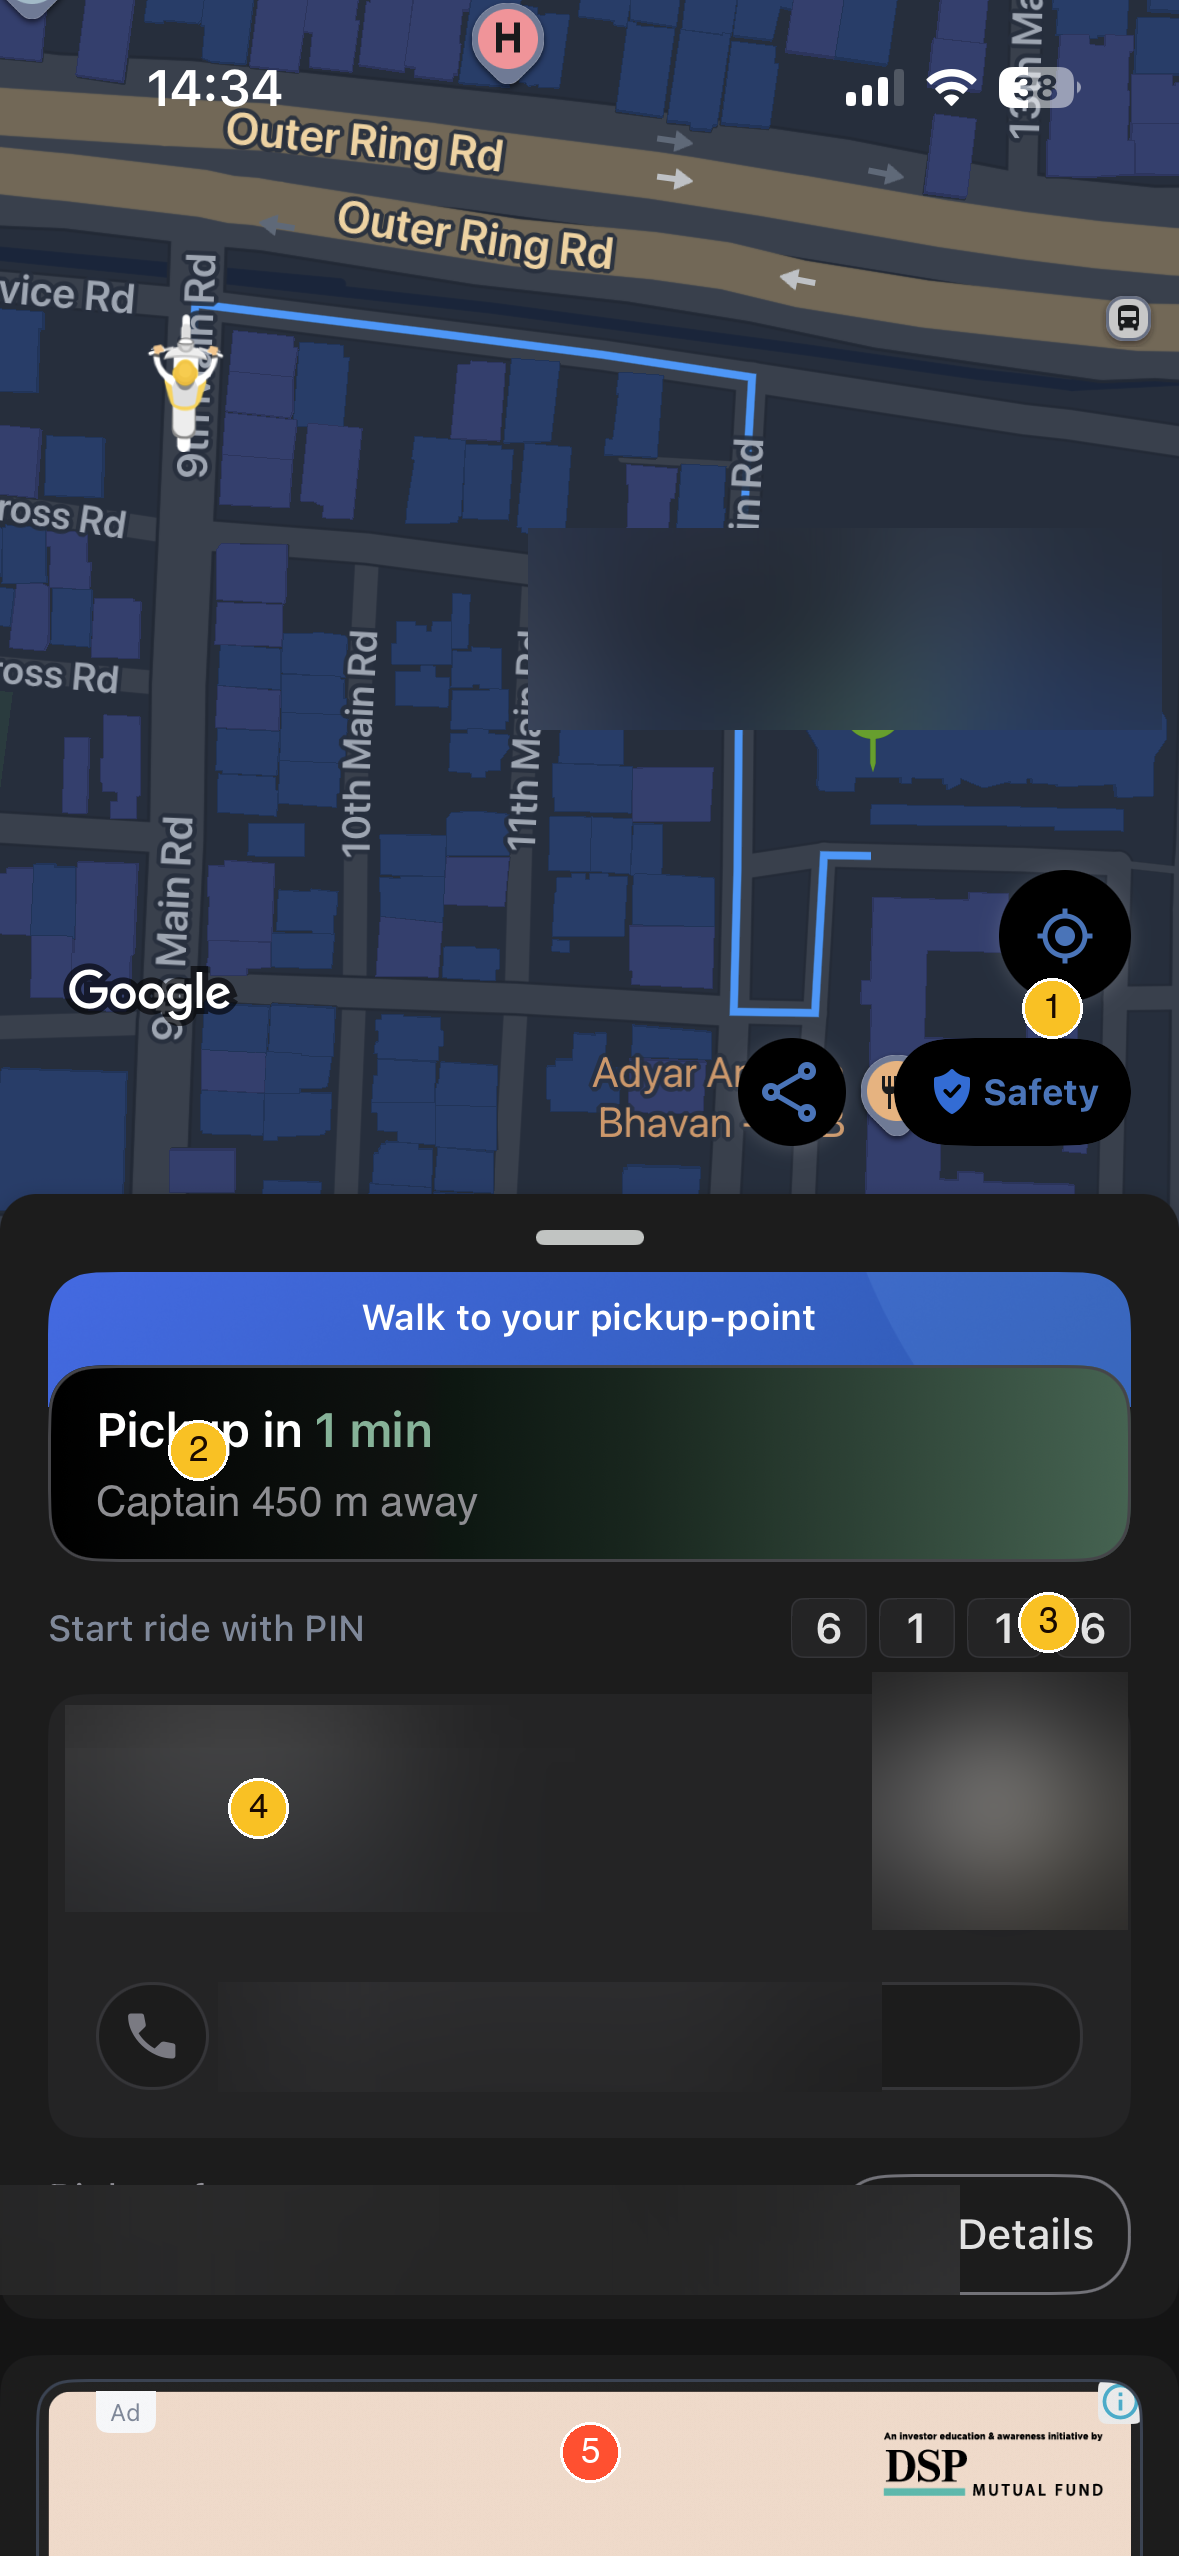
Stage 4 · Captain Approach (1–5 minutes)
Live captain location on the map with minute-precise ETA: "Pickup in 1 min · Captain 450m away." Captain card shows name, vehicle number, and star rating before boarding. PIN verification ("6 1 1 6") is required before the ride starts. The direct call button is visible without leaving the screen. PIN boarding adds a step but prevents wrong-captain boards — a reasonable trade-off. The opportunity is GPS-based auto-confirm on proximity (<30m), which eliminates the PIN overhead for repeat users without losing the safety check.
Stage 5 · Ride
Captain arrives → PIN verified → rider boards → in-trip map tracking is active. The "Safety" button is persistently labelled on the map — visible without any tap, which corrects a prior assumption that safety controls were buried. The one friction point: a DSP Mutual Fund ad appears on the live tracking screen while the captain approaches. The rider wants ride status at this moment, not a promotion.
Stage 6 · Payment & Receipt
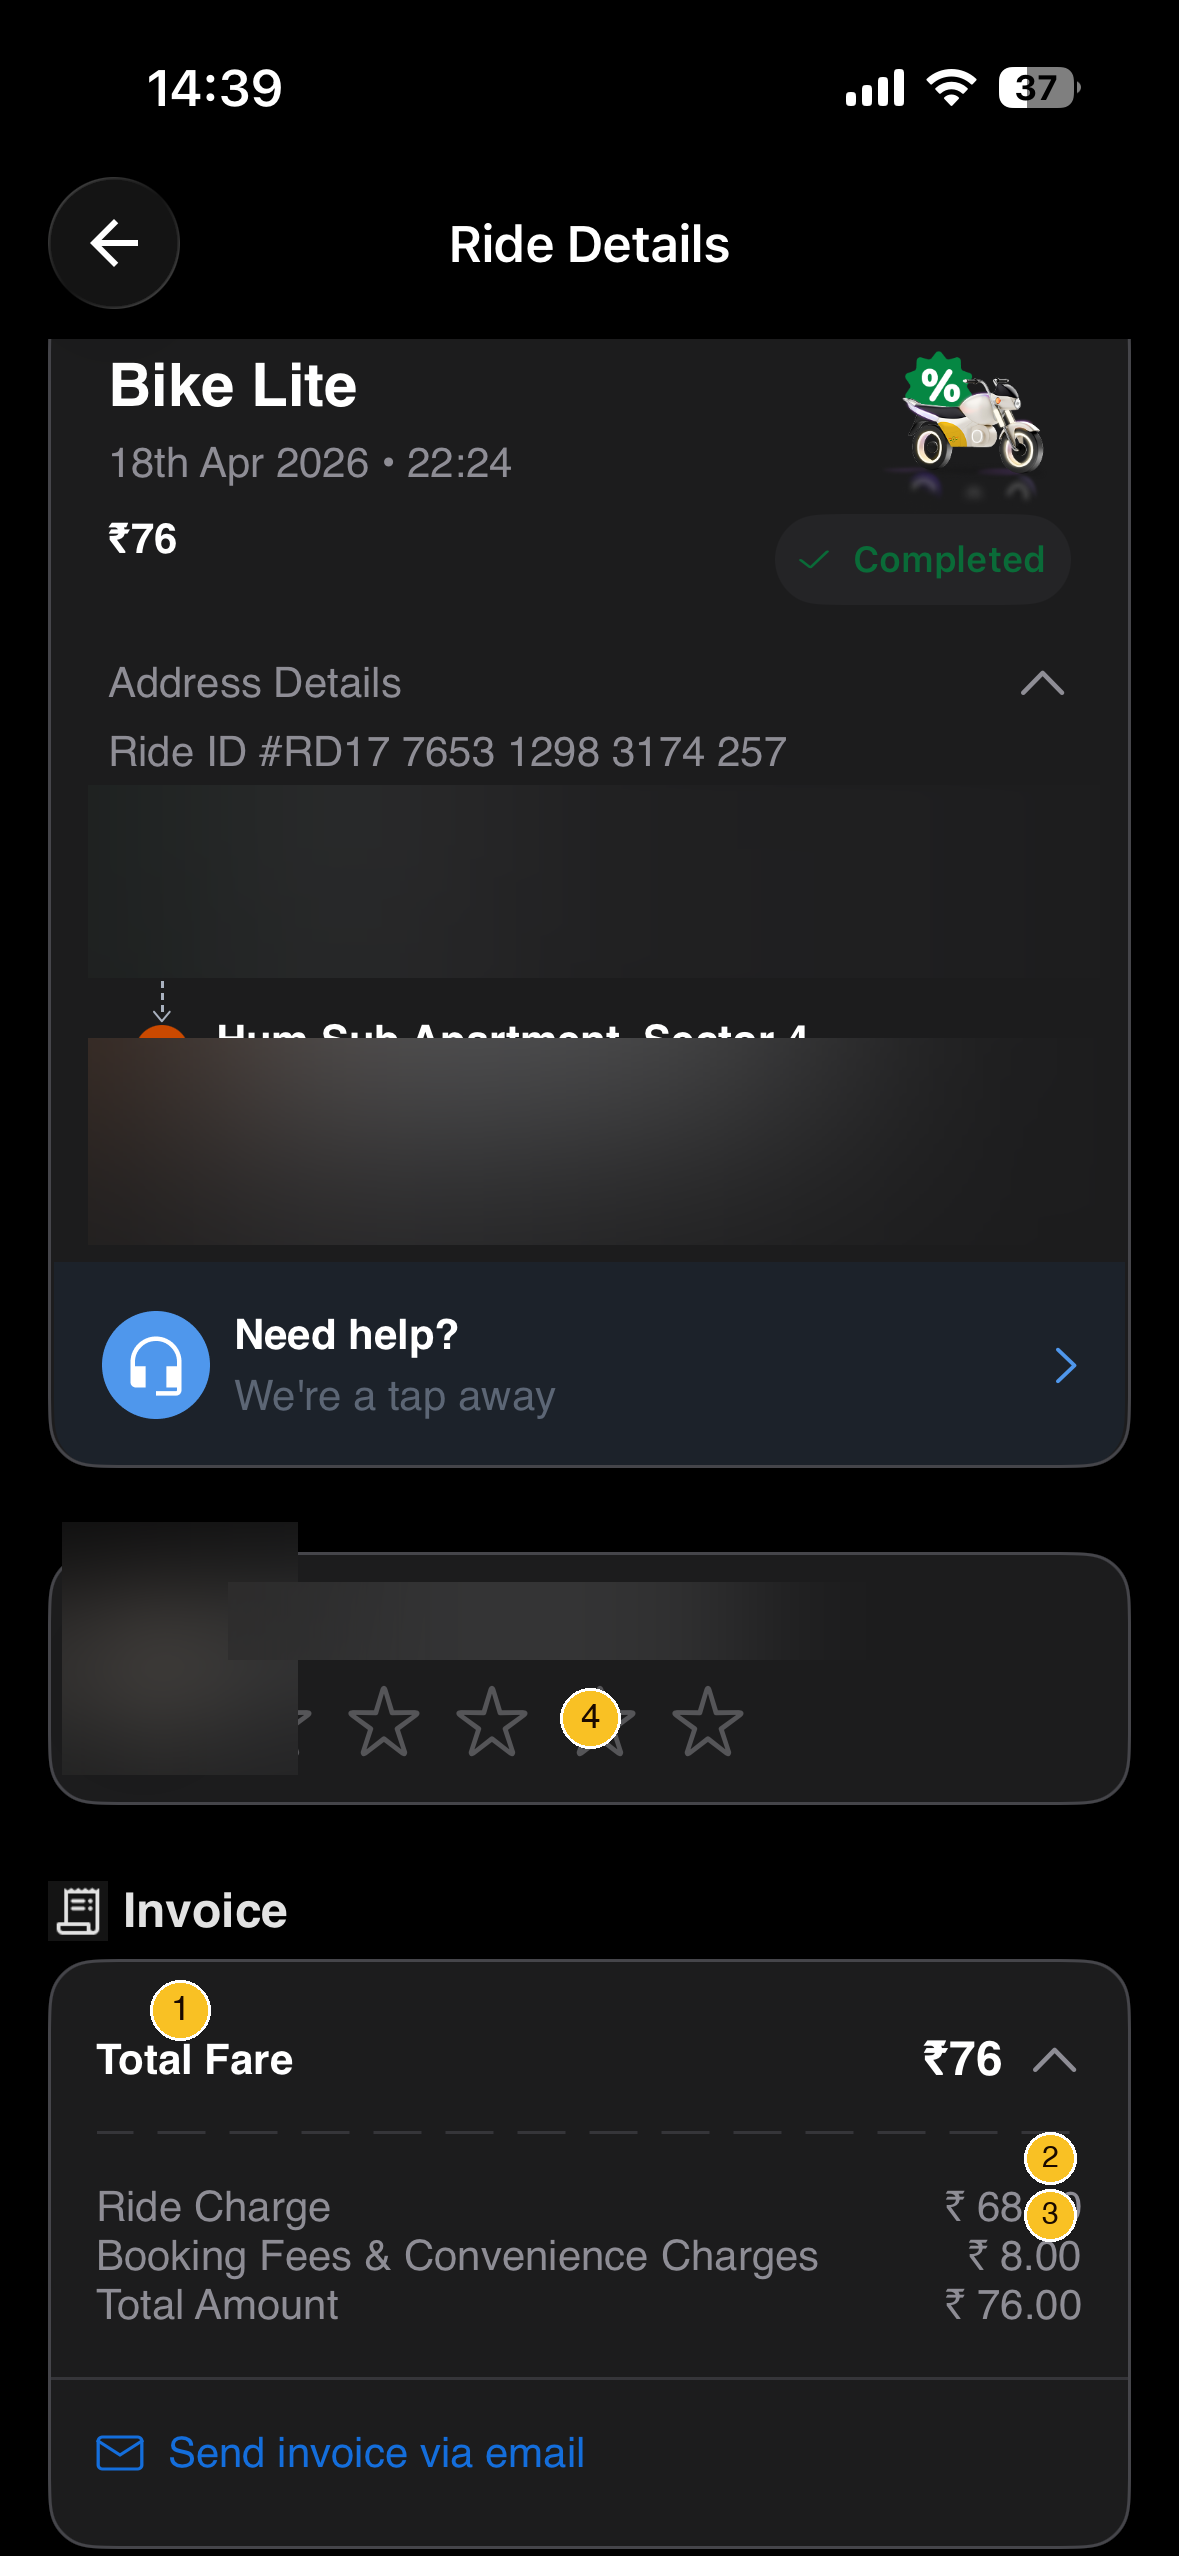
Fare collected (UPI / cash). Receipt shows the total fare with no commission deduction visible. Total payable has no visual distinction from other line items — a bordered row would make it immediately scannable. The untapped opportunity: a green "You saved ₹119 vs. cab" chip on the receipt, surfaced at exactly the moment the user has just experienced the value.
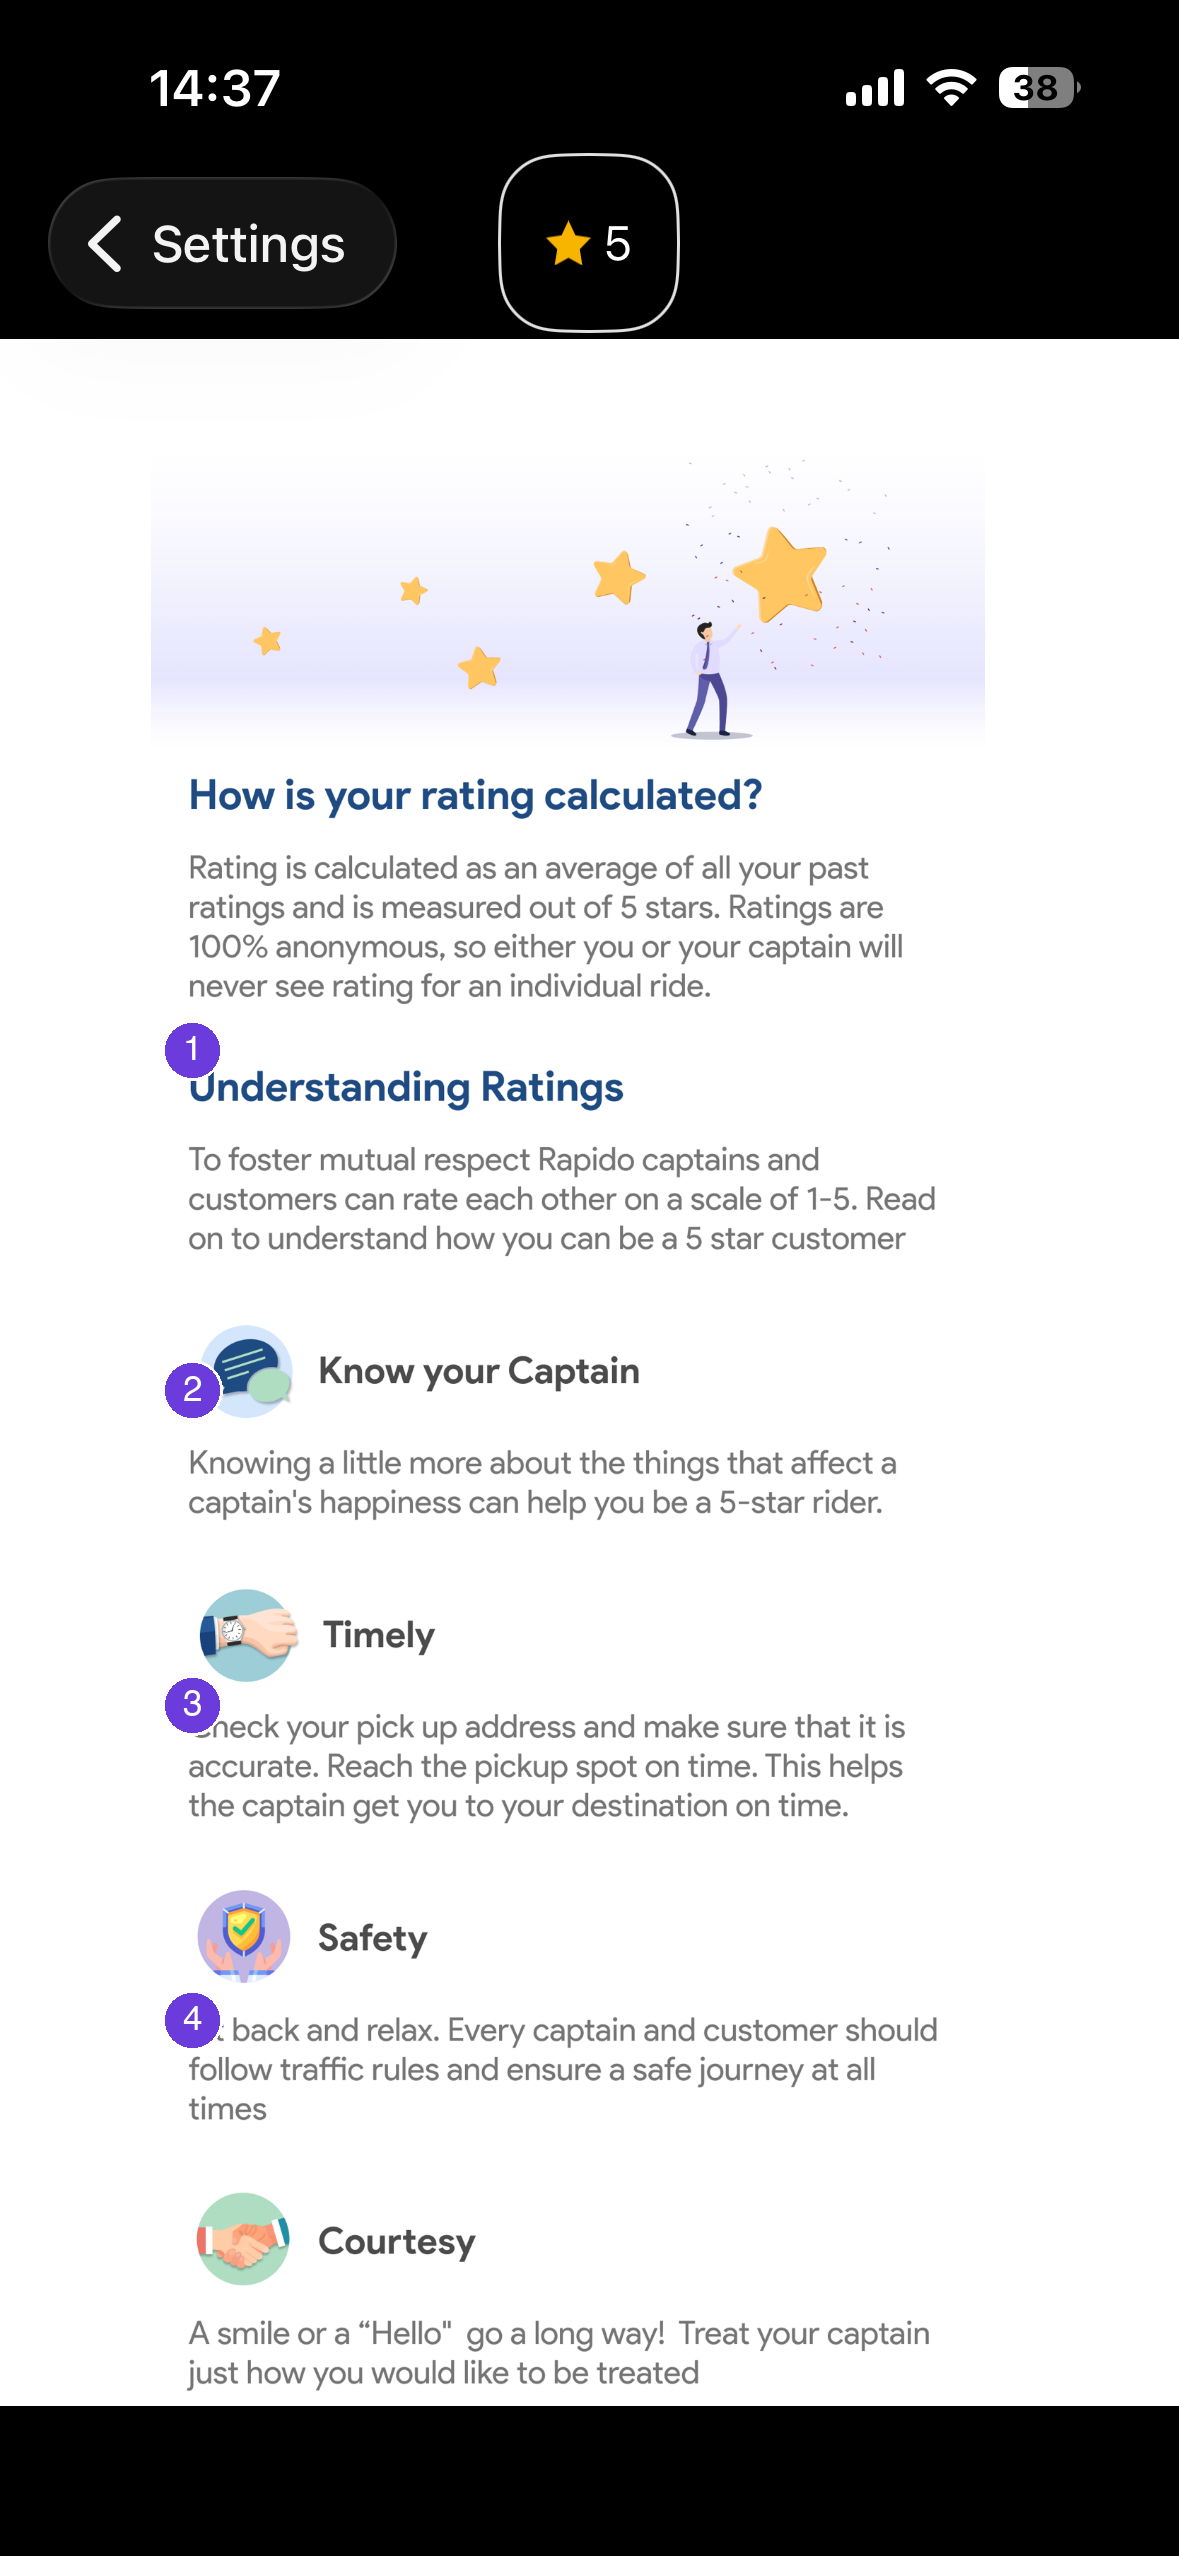
Stage 7 · Rating
1–5 star prompt fires immediately post-drop, bidirectionally: the captain rates the rider anonymously on the same screen. Rating pillars shown: Know your Captain · Timely · Safety · Courtesy — each with a written rubric, making feedback specific rather than a number with no context. The friction: 70%+ of users skip immediate post-drop prompts. Contextual rating — 10 minutes after arrival, when the commute outcome is known — converts significantly better. These structured pillars are also underused: the scores could feed a rider quality index that unlocks priority matching for high-rated riders, creating a retention mechanic from data that currently goes nowhere.
Key Friction Points Summary
| Stage | Friction | Severity | Fix |
|---|---|---|---|
| Matching (mid-search) | Buffering load screen - no live progress signal | Critical | Progress-framing: "Contacting captain X of Y" (Rec 1) |
| Matching (post-failure) | "X didn't accept" failure-frame + tip upsell dark pattern | High | Reframe to progress copy; remove tip prompt (Rec 1) |
| Boarding | PIN verification friction under time pressure | Medium | GPS proximity auto-confirm (<30m) |
| Destination | Hidden pre-acceptance → 18–22% captain cancellations | High | Conditional Disclosure (Rec 2) |
| Receipt | No visual closure on total payable | Low | Bordered total row (Law of Closure) |
| Rating | <30% completion, immediate prompt | Low | Delayed contextual prompt (+10 min post-drop) |
03 - Strategic Positioning
| Dimension | Uber | Rapido |
|---|---|---|
| Revenue Model (Platform) | 20–25% commission/ride | SaaS captain access fee |
| 2-Wheeler | Uber Moto (~10–15 cities) | Bike taxi - core product, 500+ cities |
| Driver Model (Oct 2025+) | Subscription fee (switched from commission) | ₹9–29/day (auto/cab confirmed lower bound ₹9) |
| Pricing | Surge 2–3× (Uber Surge) | Capped ≤20% adjustment |
| City Reach | ~100 cities (estimated) | 500+ cities |
| Captain Take-Home (₹100 ride) | ₹75–80 | ₹99+ |
| Regulatory Risk | Low | High (bike taxi bans in KA, MH, TN) |
Core Insight: 70% of Indian urban commutes are under 5 km. A bike or auto isn't an inferior alternative - it's the optimal solution. Rapido commoditised the solution and charged captains for access, not for outcomes.
Product implication of the regulatory risk row: Bike-taxi bans in Karnataka, Maharashtra, and Tamil Nadu are not abstract - they constrain Rapido's bike revenue in three of India's largest urban markets. The product hedge is already visible in the data: auto penetration is deepening in regulated metros while bike expansion accelerates in Gujarat, UP, Bihar, and Rajasthan where no ban exists. For a Rapido PM, this means the auto category is not a fallback - it is the regulated-market growth vehicle. Roadmap sequencing should reflect this: auto feature velocity (destination disclosure, earnings guarantee, seat-share depth) should match or exceed bike in markets where bike-taxi legality is contested.
04 - Problem Statement
Problem 1 - Affordability: Uber surge pricing makes daily commutes ₹4,000–5,000/month; Rapido bike costs ₹800–1,200/month for the same route. Uber switched to a subscription model for Indian drivers in October 2025, but Uber Moto still operates in only ~10–15 cities and its rider-facing fares remain 25–40% higher than Rapido bike.
Problem 2 - Captain exploitation: Traditional 20–30% commission converts ₹1,500 gross to ₹1,050–1,200 net. Rapido's ₹9–29/day model (illustrative midpoint: ₹15) converts the same gross to ₹1,485 net at the midpoint fee.
Problem 3 - Unorganised auto market: 90% of India's auto-rickshaw market is informal - opaque pricing, routine refusals, no accountability. Rapido digitised the supply without changing the vehicle.
Problem 4 - First/last-mile gap: Metro rail covers 20+ cities. Tier-2/3 intracity connectivity is overwhelmingly informal. Rapido is the only aggregator operating at scale in 500+ cities.
05 - UX Analysis
Service Portfolio - What Rapido Actually Offers
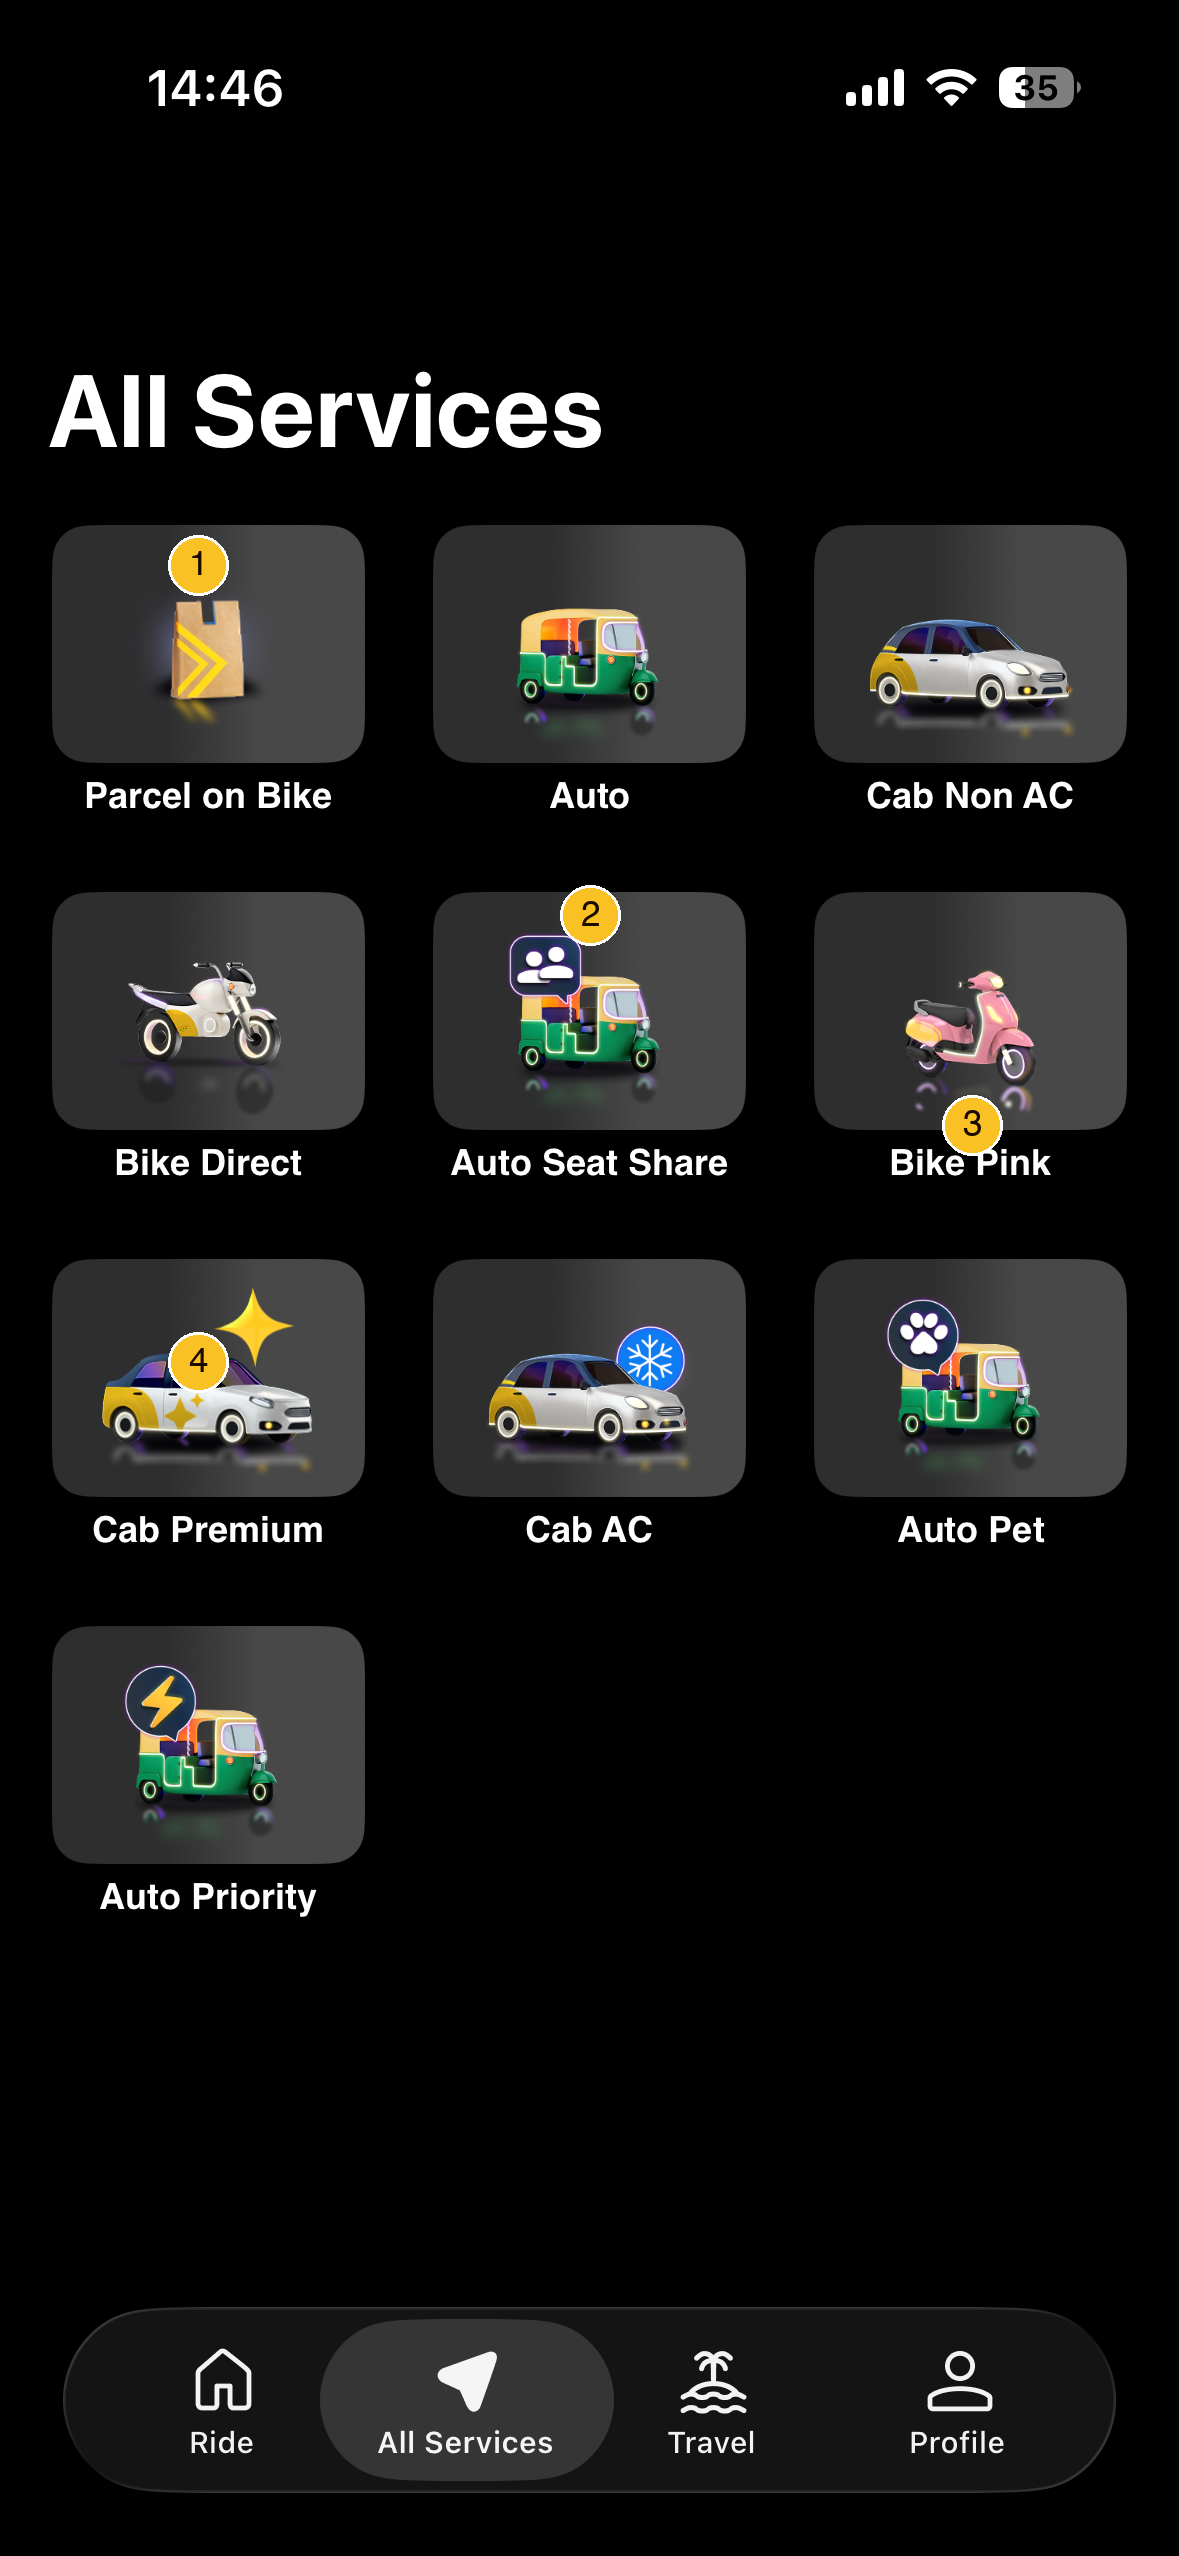
Rapido's mode breadth is underappreciated. It isn't a bike-taxi app that added cabs - it's a multi-modal urban utility layer offering everything from ₹25 Bike Direct to Cab Premium. Auto Seat Share and Bike Pink (women captains) address segments Uber Moto and Ola have not built for at this depth. Auto Pet removes a genuine pain point with zero infrastructure cost (same captains, same vehicles, different intake criteria).
Rider App - Mode Selection & Fare Preview
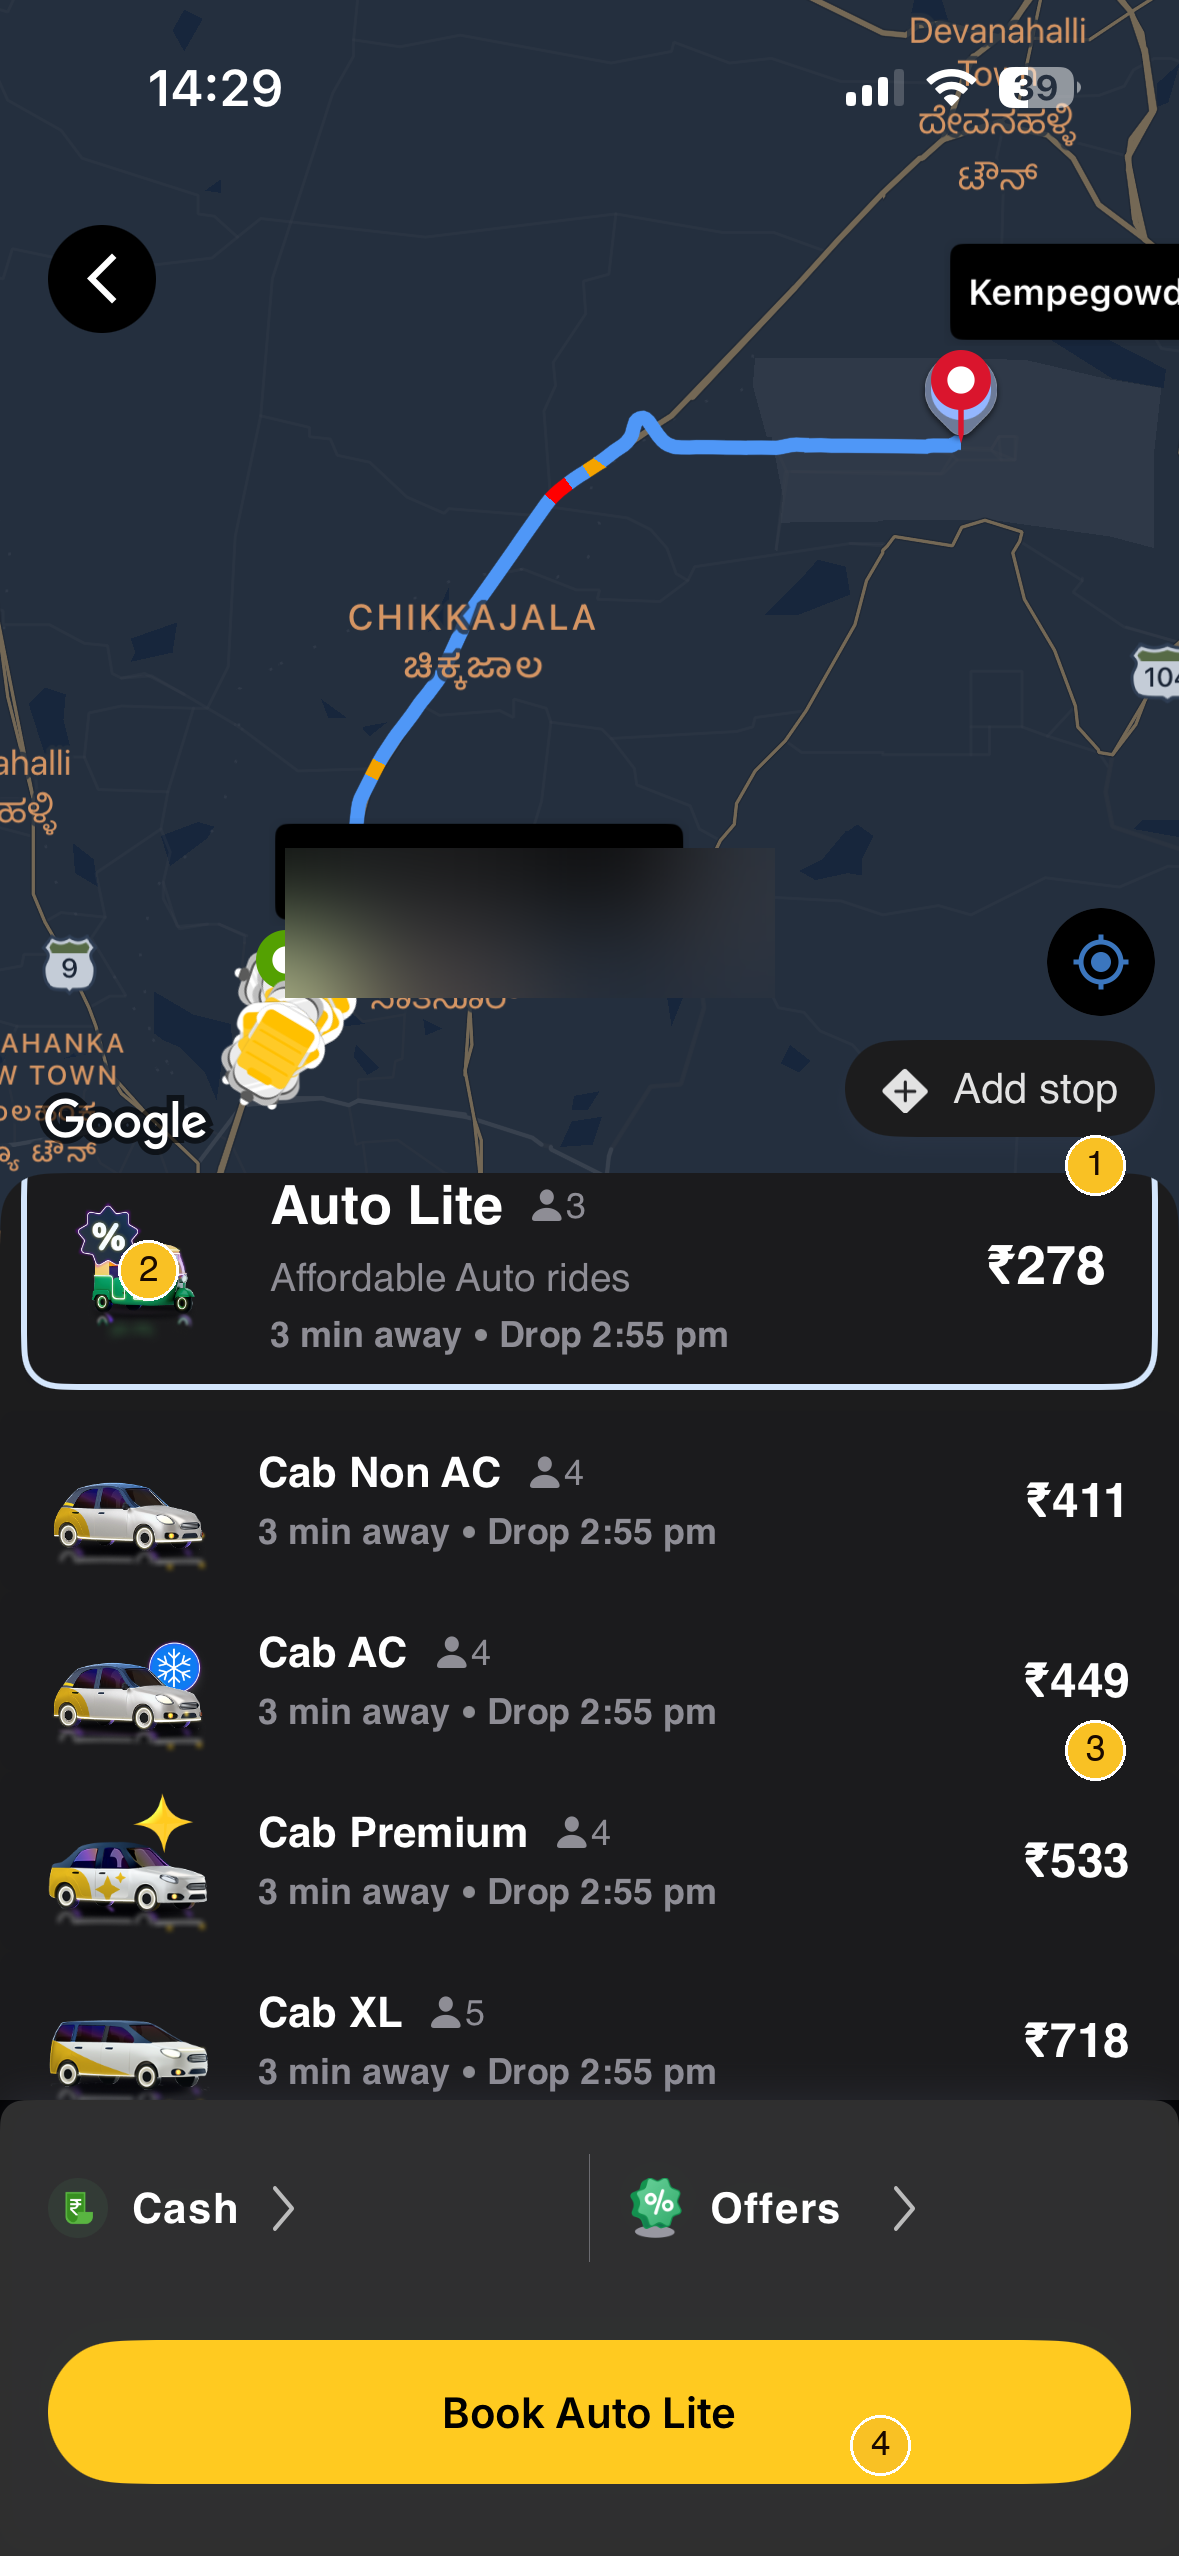
- Price anchoring: All modes visible before commitment - eliminates the "how much will this cost?" anxiety loop. The upward price ladder anchors riders toward cheaper modes.
- ETA precision: "3 min away" is confirmed minute-specific - matches Uber's standard and reduces the arrival uncertainty that drives parallel-app opens.
- One-tap booking: "Book" CTA collapses select → confirm to a single interaction for repeat routes.
Booking Flow - Strengths & Gaps
Confirmed Strengths: Upfront multi-modal pricing · Minute-precise ETA · Persistent Safety button · Direct call button pre-pickup · PIN verification
Gaps:
- No ride scheduling: Cannot pre-book for 5 AM airport runs - Ola and Uber both offer this
- Destination hidden pre-acceptance: Causes 18–22% captain cancellation rate
- PIN boarding friction: "6 1 1 6" verification adds a step under peak-hour time pressure
- Rider-side ads on the tracking screen: DSP Mutual Fund ad on the live pickup/tracking screen - clutter at a high-attention moment
06 - Marketplace Dynamics
Core tension: Need enough riders to keep captains busy AND enough captains for <5-min pickups. Neither side joins without the other.
Rapido's resolution: ₹30 bike rides generate 3× more daily requests than ₹120 cab fares → higher captain utilisation → captains stay active → more supply → lower ETAs → more riders join. The daily access fee (₹9–29) is a commitment device: a captain who has already paid has sunk-cost incentive to stay online even on slow mornings.
| Cancellation Type | Rate (Est.) | Primary Cause |
|---|---|---|
| Rider cancels | 8–10% | Found alternate, impatience |
| Captain cancels | 18–22% | Destination inconvenient post-acceptance |
Why destination stays hidden: Showing it causes captains to cherry-pick long rides. ~40% of Rapido's demand is under 2 km - disclosure would gut supply for the most common use case.
The SaaS model made visible in a single receipt: The bill screenshot below is the clearest proof that Rapido's model works - the rider pays ₹76 total; ₹68 is the ride charge (going to the captain), and ₹8 is the booking fee (Rapido's SaaS slice). No commission taken from the ride charge. The captain's ₹68 is untouched by Rapido's revenue mechanics.
07 - Recommendations
Problem: Matching Screen - Data Exists, Framing Fails
Rapido already captures and displays rejection data - and crucially, it surfaces this count live during the search, not just at failure. "6 of 58 captains didn't accept your ride" appears as a running counter while the match is still in progress. The backend event data exists and flows to the UI in real time. The problem isn't missing data. It's two compounding UX failures:
- Failure framing: "Didn't accept" is defeat language. It tells the rider the platform failed them - not that the system is actively working. Every refresh of this screen increases churn intent.
- Dark pattern on failure: The same screen surfaces a ₹10–₹40 tip upsell ("Add a tip to get a ride faster") and a service expansion nudge (Cab Non AC ₹584, Scooty Direct ₹430). Monetising the rider's highest-anxiety moment via a tip prompt is a trust-eroding dark pattern - it implies Rapido's normal service isn't trying hard enough until paid to do so.
Recommendation 1: Progress Reframing + Dark Pattern Removal
What this is not: A feature build. The rejection count data already exists and is already displayed. This is a copy and UX pattern change.
Part A - Mid-search progress framing (2-week front-end change):
Replace the loading screen with a live counter that reframes the same data as forward motion:
"Contacting captain 3 of 12 nearby…"
After acceptance:
"Booked · Rajesh accepted · 4 min away"
Part B - Remove the tip upsell from the rejection screen (1-day change):
The tip prompt belongs in the post-booking flow as an optional enhancement - not as the "solution" to a failed match. Move it to the receipt screen or post-trip rating. Remove it entirely from the searching/rejection screen.
Part C - Reframe the escalation screen (1-week change):
Replace "6 of 58 captains didn't accept" with:
"Still searching · 12 captains in range · We'll keep trying"
Service expansion nudges (Cab Non AC, Scooty Direct) are valid - but present them as options, not as a consequence of failure.
Before vs. after:
| Current State | After Rec 1 | |
|---|---|---|
| Mid-search | Live counter: "6 of 58 didn't accept" - failure framing during active search | "Contacting captain 3 of 12 nearby…" - same data, progress framing |
| Post-failure copy | "6 of 58 captains didn't accept" | "Still searching · 12 captains in range" |
| Failure screen CTA | ₹10–₹40 tip upsell | Remove entirely from this screen |
| After acceptance | "Captain found" | "Booked · Rajesh accepted · 4 min away" |
| Rider response | Opens Ola at ~60 seconds | Engaged - watching live count |
| Outcome | ~23% matching-phase abandonment | Target ≤17% abandonment |
| Engineering cost | - | ~3 weeks total; copy change is Day 1 |
Note on escalation severity: The rejection count climbs in real time mid-search - "6 of 58 captains didn't accept" appears and the number keeps rising as the search continues. Each refresh of a failure-framed counter increases churn probability. Progress framing converts the same data into a reassurance signal.
RICE: Reach 74M MAUs (company-stated) · Impact 5/10 · Confidence 70% · Effort 3 weeks = ~86,000,000. This is a copy and UX pattern change, not a feature - Impact and Confidence should reflect that, not be inflated by the large reach number.
Recommendation 2: Conditional Destination Disclosure
The design logic behind the 3-tier structure:
40% of Rapido's demand is <3km rides. If destination is shown upfront for all rides, captains can and will decline short-hops systematically - gutting supply for the most common use case. The 3-tier structure preserves short-ride supply, gives captains route agency on medium rides only once they are already committed to the vicinity (reducing the cherry-picking incentive), and provides full transparency on long rides where route preferences are most legitimate.
- Rides <3 km - destination hidden: Captain must accept to see destination. Short-hop supply is protected. Captains who consistently decline short rides after acceptance are surfaced by accept-then-cancel pattern and flagged separately.
- Rides 3–8 km - destination revealed at 1km proximity: Captain has already navigated toward pickup. Disclosure at this point informs planning (can they complete this route before the next peak hour?), not cherry-picking.
- Rides >8 km - destination shown on the accept screen: Long rides warrant captain consent. A captain who accepts a 14km trip to an edge area has done so knowingly - post-acceptance cancellation is harder to justify.
Implementation spec (3-week sprint):
- Backend:
destination_distanceis already computed for fare pricing - add adisclosure_tierflag (0/1/2) to the match request payload. No new data collection. - Captain app: Conditional disclosure UI on the accept screen (Tier 3: upfront) and a geofence-triggered reveal card (Tier 2: at 1km proximity). Three UI states on one screen; no new screen flow.
- Rider app: No changes.
- WMS/ops: No changes.
Failure modes:
- Location-based cherry-picking replaces destination-based cherry-picking. Captains learn that pickups near residential areas correlate with short fares; pickups near offices correlate with long rides. Disclosure shifts from the app to spatial inference. Mitigation: monitor captain accept rate by pickup zone type - systematic divergence flags the behaviour.
- Pre-confirmation cancellations replace post-acceptance cancellations for Tier 2 rides. A captain who reaches the 1km geofence, sees a medium-distance destination they dislike, and declines - the rider still gets a rebooking experience. The timing shifts but the outcome doesn't. Mitigation: track pre-confirmation cancellation rate separately from post-acceptance cancellation rate in the treatment group. The North Star is the rider's rebooking rate, not the captain cancellation rate alone.
- Tier 3 acceptance rate drops in the short term. Captains who previously accepted >8km rides without knowing the destination will now make informed decisions. Some will decline. This is the intended outcome - replacing uninformed acceptance followed by cancellation with informed acceptance. Monitor: ride completion rate for Tier 3 trips (accepted and completed, not just accepted).
RICE (directional):
- Reach: all captain-days involving rides in the 3–8km and >8km tiers (estimated ~60% of total daily ride volume, not Rapido-disclosed)
- Impact: 7/10 - captain post-acceptance cancellations (est. 18–22%) are one of the top drivers of rider NPS degradation
- Confidence: 60% - the 3-tier distance thresholds (3km, 8km) are calibrated estimates; A/B will validate whether the boundaries hold or need adjustment
- Effort: 3 weeks
- Score: directional positive; specific numeric score depends on ride volume data not publicly available
Expected impact: Captain post-acceptance cancellation rate est. 18–22% → target ≤12% for Tier 3 rides. Rider rebooking rate (a direct rider-experience metric) should fall in proportion. NPS improvement is a second-order effect - not a primary test metric.
Recommendation 3: Captain Earnings Guarantee
If a captain pays the daily access fee, stays online ≥8 hours, and maintains >75% acceptance rate but earns <₹600 gross - Rapido refunds the daily access fee (₹9–29 depending on vehicle type) and tops up to ₹600. Cap: 10 guarantee days/month.
Economics (directional model):
The guarantee trigger requires all four conditions simultaneously: captain paid the access fee, stayed online ≥8 hours, maintained >75% acceptance rate, but grossed <₹600. This is a narrow set - a captain who actively tries to earn but has a genuinely bad day, not a chronic low-performer.
Directional cost estimate (stated assumptions explicitly):
- Active captain-days: est. 2.5M/day (28–33% of 9M registered, estimated)
- Trigger frequency: 2–4% of qualifying captain-days hit all four conditions (estimated; exact figure is not publicly disclosed)
- At 2%: ~50,000 triggers/day. At 4%: ~100,000 triggers/day.
- Average cost per trigger: (₹600 floor − est. ₹450 bad-day gross) + blended fee refund (est. ₹15) = ~₹165/trigger
- Annual cost range: 50,000–100,000 × ₹165 × 365 = ₹30–60 Cr/year (directional; highly sensitive to the trigger rate assumption)
Against ₹275 Cr FY25 subscription revenue, this is 11–22% of the revenue the guarantee is meant to protect. That cost is only viable if captain retention improves enough to offset it.
Break-even logic: Gig platform driver onboarding costs typically run ₹500–2,000/driver (public benchmarks from Ola/Uber analyst reports; not Rapido-specific). At 9M registered captains with an estimated 30% annual churn, replacing churning captains costs roughly 2.7M × ₹1,000 (midpoint) = ₹270 Cr/year in recruiting and onboarding. A 10% reduction in churn = 270,000 fewer churning captains × ₹1,000 = ₹27 Cr saved - roughly matching the lower-end guarantee cost. A 15% churn improvement makes the guarantee solidly net-positive.
The central assumption to validate: does the bad-day earnings uncertainty drive a measurable share of captain churn? A captain NPS survey in the treatment cohort (pre- and post-guarantee announcement) is the fastest way to size this before committing to the full program.
Recommendation 4: Tier-2 Localisation Sprint
The Dinesh persona surfaces a gap that Recs 1–3 don't address: 40%+ of Rapido's 500-city base is using a product designed for urban, English-comfortable, smartphone-native riders. It works for Dinesh because he adapted - not because it was built for him.
Two changes, one sprint (~3 weeks):
- Hindi-first booking flow - Toggle on device language setting. Three screens need it: mode selection, captain confirmation, post-trip rating. Not a separate app; a localisation pass on existing screens.
- SMS fallback for booking confirmation - When data drops mid-booking (patchy 3G in Tier-2 cities), send an SMS with captain name, vehicle number, and PIN. Prevents the "did it even book?" anxiety that causes duplicate bookings and cancellations.
Success metrics:
| Metric | Baseline (Est.) | Target |
|---|---|---|
| First-ride completion rate, Tier-2 cities | ~65–70% (estimated; not publicly disclosed) | ≥78% |
| D30 rider retention, new Tier-2 users | ~38% (modelled from AARRR section) | ≥48% |
| Hindi-flow adoption rate (% of Tier-2 users selecting Hindi within 30 days of launch) | 0% (feature doesn't exist) | ≥35% |
| SMS fallback trigger rate (measures 3G data-drop frequency during booking) | Not tracked | Validate problem size before shipping |
A/B test setup: Pilot in Patna and Kanpur - both Hindi-dominant, above-median 3G connectivity issues, no significant Ola/Uber presence as confound. Treatment: Hindi-first booking flow (language auto-detected from device settings, manual override available). Minimum run: 6 weeks to capture full new-user cohort D30 retention. Kill flag: if first-ride completion rate does not improve by ≥5pp within 3 weeks, the localisation gap is not the primary barrier - investigate whether the issue is supply density or pricing instead.
One thing to check before building the SMS fallback: instrument the current booking flow to measure data-drop events during captain confirmation. If the rate is below 1% of bookings, it's engineering cost with no meaningful rider impact. If it's above 5%, ship immediately.
How Recs 1–4 Connect
These don't operate independently. Conditional destination disclosure (Rec 2) reduces captain cancellations → which improves first-attempt matching success → which means the progress counter (Rec 1) reaches high counts less often, reducing the failure mode it's designed to address. The earnings guarantee (Rec 3) keeps more captains online → which shortens matching time → which further limits the scenarios where Rec 1's counter becomes anxiety-inducing rather than reassuring. Rec 4 operates on a different population but the same underlying logic: reduce uncertainty signals (opaque booking, no language fit) that drive first-ride abandonment.
08 - PM Frameworks
Jobs-to-be-Done (JTBD)
| User Type | Functional Job | Emotional Job | Social Job |
|---|---|---|---|
| Daily Commuter | "Get to office on time without paying ₹160 for a cab" | "Feel financially smart about my commute" | "Not be the person late because of surge pricing" |
| Late-Night Traveler | "Get home safely at midnight without pre-booking" | "Feel safe and in control at an odd hour" | "Not have to ask a flatmate to pick me up" |
| Tier-2 Resident | "Get a reliable ride in a city Ola/Uber doesn't serve at scale" | "Feel like modern urban mobility is accessible to me" | "Not depend on informal autos and price negotiation" |
| Captain (Supply) | "Maximise earnings within my chosen working hours" | "Feel like I run my own business, not Uber's contractor" | "Be respected as an independent operator, not a gig worker" |
Kano Model
| Feature | Category | Reasoning |
|---|---|---|
| Live captain location on map | Must-Have | Absence triggers cancellations; zero delight value if present |
| Upfront multi-modal fare display | Delighter → Must-Have | Was unique to Rapido; now expected by power users after 2–3 rides |
| Minute-specific ETA ("4 min away") | Must-Have | Already present - "Pickup in 1 min" confirmed; absence would now cause immediate complaints |
| Rejection count visibility | Performance | Present post-failure; absent mid-search. Progress framing converts failure signal to trust signal |
| Ride scheduling (pre-book) | Performance → Must-Have | Ola/Uber both offer it; absence is a product gap, not a neutral |
| Captain Earnings Guarantee | Delighter | Completely unexpected; would dramatically shift captain retention |
| In-app UPI (no app-switch) | Must-Have | Zepto (Jan 2026) and Swiggy (2024) set the standard; Rapido must match |
| Persistent Safety button | Must-Have | Already present and labeled - confirmed by screenshot; removing it would cause immediate trust damage |
AARRR
| Stage | Rapido's Mechanic | Key Metric | Bottleneck |
|---|---|---|---|
| Acquisition | "₹0 first ride" promo codes, Tier-2 word-of-mouth | CAC | Low in Tier-2; high in metros where Ola/Uber dominate |
| Activation | First successful bike ride (on-time, correct pickup) | First-ride completion rate | Matching failure on first attempt → 40–50% early churn |
| Retention | Daily commute habit + low fare switching cost | D30 rider retention | Opaque matching builds low-grade distrust across repeat users |
| Revenue | Captain SaaS fee (not rider-side); Rapido Money fintech | Revenue/captain/day | Captain churn = direct revenue loss, independent of ride volume |
| Referral | "Invite & Earn" credit for referrer and referee | K-factor | Low virality in metros; stronger in tight Tier-2 social networks |
HEART Framework
| Dimension | Metric | Target | Why It Matters |
|---|---|---|---|
| Happiness | Post-ride NPS | >50 | Tracks satisfaction vs. Ola/Uber |
| Engagement | Rides/rider/month (daily commuter segment) | >14 | Frequency = retention predictor and captain demand signal |
| Adoption | % new users completing 3+ rides in first week | >45% | Early habit drives LTV; first-week drop-off is near-permanent |
| Retention | D30 rider retention | >55% | Current est. ~48–52% (modelled); below this = acquisition treadmill |
| Task Success | Matching-phase booking completion rate | >83% | Current ~77%; Progress Reframing (Rec 1) targets +6pp |
09 - A/B Test Designs
Test setup: Geo-split across Delhi NCR (Dwarka / Connaught Place corridor) + Pune (Hinjawadi / Baner) - markets with above-average captain rejection rates during 8–10 AM peak. Combined volume of ~200K+ rides/week provides statistical significance within 3 weeks.
Split: 50/50 · Control (current static loading screen) vs. Treatment (live "N captains contacted / M declined" counter during matching phase).
Minimum run: 3 weeks - captures full Mon–Sun pattern and ≥3× repeat-user exposure for the daily commuter cohort.
| Metric Type | Metric | Baseline (Est.) | Target |
|---|---|---|---|
| North Star | Matching-phase booking completion rate | ~77% | ≥83% (+6pp) |
| Primary | Matching-phase abandonment rate | ~23% | ≤17% |
| Primary | Parallel-app open rate during matching (focus-loss event) | Untracked | ↓ measurable vs. control |
| Guardrail | Captain acceptance rate | Tracked | Must not drop >1.5pp - kill flag |
| Guardrail | Post-match rider cancellation rate | Tracked | Flat or ↓ |
Kill conditions: If captain acceptance rate drops >1.5pp in the treatment group within Week 1, pause - the rejection counter may be creating rider pressure on captains. If matching-phase completion shows no improvement by Day 14, reassess counter placement and copy.
Most plausible failure mode not captured above: The counter working too well at high counts - a rider who watches the rejection number climb well past a dozen may be more anxious than a rider who saw nothing. Consider a counter cap variant (show count only up to N=10, then switch to "Still searching…") as a second treatment arm.
A/B Test Design - Recommendation 2: Conditional Destination Disclosure
What to test first: Tier 3 only (>8km rides shown upfront). This is the cleanest testable unit - binary on/off, no geofence complexity, no proximity trigger.
Setup: Geo-split across Chennai and Ahmedabad - both have high auto usage and above-average long-ride distances. Combined volume sufficient for significance within 4 weeks.
Split: 50/50. Control: current flow (destination hidden until after acceptance). Treatment: destination shown on accept screen for rides >8km.
| Metric Type | Metric | Baseline (Est.) | Target |
|---|---|---|---|
| North Star | Captain post-acceptance cancellation rate, Tier 3 rides | ~20% | ≤12% |
| Primary | Captain acceptance rate, Tier 3 rides | Tracked | Must not drop >8pp vs. control |
| Primary | Rider rebooking rate within a session | Tracked | ↓ measurable vs. control |
| Guardrail | Total ride completion rate | Tracked | Flat or ↑ - net effect must be positive |
Kill flag: If rider rebooking rate within a session rises in treatment vs. control, pre-confirmation declines are simply replacing post-acceptance cancellations - same rider experience, different timing. Pause and reassess the disclosure trigger (consider reducing Tier 3 threshold from 8km to 6km).
One important caveat: captains in the treatment group may change acceptance behaviour in the first week as they learn what disclosure means. Measure acceptance rate as the Week 3–4 steady-state average, not the campaign mean.
10 - North Star & Metrics
North Star
Rides per Active Rider per Month - because it captures supply health (captains earning enough to stay online), product reliability (matching success, ETA accuracy), and pricing competitiveness simultaneously. A rising rides/rider/month means Rapido is the default transport choice, not a backup. A falling number means the parallel-app behaviour is winning.
Current benchmark (estimated): ~9–11 rides/active rider/month. Daily commuter cohort target: ≥14.
SaaS Unit Economics (Modelled, FY25 basis)
| Line Item | Figure | Notes |
|---|---|---|
| Captains paying access fee | ~2.5–3M active daily (est.) | 9M registered; est. 28–33% daily active |
| Daily access fee (blended avg) | ~₹15/day | ₹9 auto, ~₹15–29 cab; blended est. |
| Daily subscription revenue | ₹3.75–4.5 Cr/day | 2.5–3M × ₹15 |
| Annual subscription revenue | ~₹1,370–1,640 Cr | Consistent with ₹275 Cr FY25 if active base was ~500–600K daily then; 14× growth implies base has scaled significantly |
| Revenue vs. ride volume | Decoupled | A 20% drop in rides on a rainy day = ₹0 revenue loss |
| Uber equivalent on same volume | Commission drops with ride volume | 20% rain-day volume drop = 20% commission revenue drop |
Rapido's revenue model is structurally more defensible than it appears in headline revenue figures. ₹275 Cr in subscription income is not a small SaaS business layered on top of ride-hailing - it is the business model. The ride marketplace is the product that justifies the fee; the fee is what generates the revenue.
If I Were Rapido's PM
How I'd measure marketplace health across supply, demand, and balance - with specific targets, red flags, and intervention playbooks.
→ View the Metrics Framework11 - Strategic Takeaways
The moat Uber cannot buy: 9M captains × 500+ cities × multi-modal density. Uber adopted a subscription-based model for Indian drivers in October 2025 (Business Standard, Oct 10 2025), narrowing the pricing-model gap Rapido pioneered. But structure isn't the moat anymore - scale is. Uber Moto operates in ~10–15 cities; Rapido covers 500+. Uber's global P&L expectations and regulatory exposure to bike-taxi bans in Karnataka, Maharashtra, and Tamil Nadu prevent the kind of deep Tier-2/3 expansion that makes Rapido structurally irreplaceable.
The EV tailwind: The PM E-DRIVE scheme (successor to FAME-II, which expired March 2024) covers subsidies of ₹10,000–15,000 per e-two-wheeler (Autocar India, April 2024). At ₹1.5/km vs. ₹4/km petrol, a captain doing 80 km/day saves ₹200 daily. Rapido's EV financing partnerships convert this policy tailwind into a retention mechanism - lower fuel costs reduce the bad-day earnings volatility that drives churn.
The Namma Yatri threat
Pure zero-commission, ONDC-based, government-backed. No fee at all vs. Rapido's ₹9/day is a real structural advantage - but only below a utilisation threshold. At 2 rides/day, Rapido's ₹9 fee costs ₹4.50/ride - worse than free. At 8 rides/day, it's ₹1.13/ride - clearly better. The competitive threat from Namma Yatri is sharpest in low-utilisation markets (Tier-2 cities where ride density is thin and captains do fewer rides/day), which is exactly where Rapido's 500-city expansion puts new captains. Namma Yatri has expanded beyond Bengaluru and announced European market entry via Automicle Holding BV (Medianama, March 2026). It still has no bike taxi and no multi-modal offering - but the structural threat intensifies if government backing accelerates Tier-2 captain density.
Sources
- Rapido raises $240M at $3B valuation led by Prosus - TechCrunch, May 2026
- Rapido valuation doubles to $2.3B after Swiggy stake sale - TechCrunch, Sep 2025
- Rapido raises $200M at $1.1B valuation - Economic Times, Sep 2024
- Rapido FY25: loss narrows to ₹258 Cr, revenue +44% - Business Standard, Jan 2026
- Rapido subscription income ₹275 Cr, 29.4% of revenue - Entrackr / Medianama, Jan 2026
- Rapido plans 500-city expansion - Business Standard, Mar 2025
- Rapido's SaaS model - captains pay flat daily fee, keep full fare - Business Standard, Feb 2024
- Uber switches to subscription model for Indian drivers - Business Standard, Oct 2025
- Namma Yatri acquires Automicle BV for European expansion - Medianama, Mar 2026
- PM E-DRIVE scheme replaces expired FAME-II - Autocar India, Apr 2024
If I Were Rapido's PM: Metrics Framework
The Challenge: Measuring a Two-Sided Marketplace
Rapido isn't just a product - it's a marketplace. Success requires balancing two stakeholders with competing incentives:
Drivers want
High earnings · Consistent trips · Low idle time
Riders want
Fast pickups · Low prices · Reliable service
A healthy marketplace keeps both sides engaged. Here's how I'd measure it.
North Star Metric
North Star
Completed Trips per Active User per Month
Supply-Side Metrics
Driver health - the fuel that powers the marketplace
Driver Utilization Rate
DEF% of online time spent on active trips (vs. waiting idle)
(Trip time ÷ Total online time) × 100
WHYLow utilization = drivers aren't earning enough → churn
Earnings Consistency (Std Dev of Daily Earnings)
DEFHow much driver earnings vary day-to-day
WHYDrivers prefer ₹800/day consistently over ₹1,200 some days, ₹400 others - predictability beats peaks
→If variance is high, offer "earnings guarantee" (Rapido already does this in some cities)
Driver Churn Rate
DEF% of drivers who go inactive (0 trips in 30 days)
WHYHigh churn = poor unit economics, constant recruiting costs
→Segment by new vs. tenured drivers - churn should decrease over time as earnings habits form
Demand-Side Metrics
Rider health - the demand that justifies supply
Match Success Rate
DEF% of ride requests that get a driver assigned within 2 minutes
WHYIf riders wait >2 min, they cancel and try Uber/Ola - the window closes fast
Surge Frequency
DEF% of trips with surge pricing applied
WHYHigh surge = bad user experience; indicates chronic supply problem, not just peak demand
→If surge >30%, it's a structural supply gap, not a peak hour issue - requires long-term fix
Repeat Ride Rate (30-day)
DEF% of riders who take 2+ trips within 30 days of first ride
WHYRepeat rate = product-market fit. One-time users don't build a business.
Marketplace Balance Metrics
The glue - keeping both sides healthy simultaneously
Supply/Demand Ratio by Zone & Time
DEF# of available drivers ÷ # of active ride requests, per zone per hour
WHYUndersupply (<0.8): riders wait too long → churn. Oversupply (>2.0): drivers idle → churn. Sweet spot (1.0–1.5): balanced.
→I'd surface this to the growth team as an input for incentive targeting - zone + time specificity is non-negotiable
Wait Time Distribution (P50 / P90 / P99)
DEFPickup wait time measured at three percentiles
WHYP90 is where user frustration kicks in - don't optimise for average, optimise for P90
Geographic Coverage Density
DEF% of city pin codes with <3 min average ETA
WHYExpansion metric - are we dense enough to win the city? Bikes cover more ground per driver than cars: Rapido's structural advantage here.
How I'd Use This Dashboard
Operational playbook - metric trigger → root cause → intervention
What This Framework Doesn't Cover
Driver ratings / rider ratings
→ Hygiene factors, not growth levers. You need them, but they don't move the North Star.
App crash rate / load times
→ Engineering metrics, not product metrics. Assume tech works; focus on behaviour.
Revenue per trip
→ Pricing is a separate strategy. This framework assumes pricing is fixed - focus is on volume + marketplace health.
Reflection: Why Marketplace Metrics Are Hard
Single-sided products (like Zepto) are simpler: more customers + more orders = success. Two-sided marketplaces require balancing opposing forces:
This is why Rapido - like Uber and Ola - obsesses over supply/demand ratios at a hyperlocal level (zone + time). The North Star isn't just rider growth; it's marketplace equilibrium - the state where both sides have enough incentive to stay.